One of the first big projects I worked on was generating mazes. After somehow coming across the book Mazes for Programmers (which to this day is still probably my favorite programming book) I implemented most of what was described and the results were cool as hell. Fast forward a bit and I once again stumbled upon something cool. This time it was Haskell, a lazy functional programming language. After reading about it for a while and seeing it being pretty consistently used in Computer Science research, I decided to try and learn it. Now anyone who's done more than a little programming will tell you that working on a project is the best way to learn a new language. After a bunch of thinking I remembered my old maze project and my vague plan to eventually go through the book again. With that and some friendly competition from my friend Kenneth who was doing the same thing in Rust, it was time to get started.
Representing Mazes
The first challenge of figuring out how to generate mazes is figuring out
how to represent them. The book takes the OO approach and defines a Grid and
Cell class. The Cell class contains information like its neighbours,
the Grid class, like the name suggests, has methods to initialize a grid
of cells into a maze among other things. This works fine but later in the
book non-square1 mazes are introduced and new classes have to be
written. From the onset my goal was to try and write code that was as
general as possible. For that I needed a useful abstraction on the pattern
of mazes which was graphs.
Graphs are one of the coolest data structures in Computer Science. They can be used to model problems in a wide range of fields and offer an intuitive way to reason about them. For our purposes the property that we use is the ability to show relationships between nodes by having an edge between them. All the information we need is then encapsulated in the structure of the graph and all the operations we need are already well known graph operations. The problem then becomes how do we map a square (rectangular) maze into a graph in a general way.
In Haskell, recursion is how you achieve looping which means that a lot of your problems involve finding a way of breaking it down into smaller chunks and combining the sub-parts into the final solution. Sound familiar? This is of course Divide and Conquer which as Wikipedia puts it:
is an algorithm design paradigm based on multi-branched recursion. A divide-and-conquer algorithm works by recursively breaking down a problem into two or more sub-problems of the same or related type, until these become simple enough to be solved directly. The solutions to the sub-problems are then combined to give a solution to the original problem
How then do we turn projecting a rectangular maze onto a graph, a Divide and Conquer algorithm? The answer took me a while to figure out but can be seen in the following image:
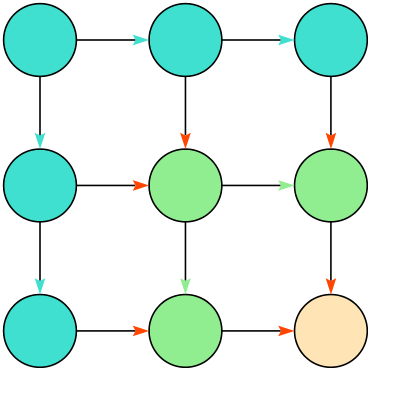
From the diagram we can see that at each step two things happen:
- A group of nodes - corresponding to the length and width of the maze - are chosen. These are represented by nodes of the same colour.
- The chosen nodes are connected together with connections being represented by the arrows with the same colour as the nodes.
The set of same coloured nodes and arrows represent a subgraph. When we finally run out of unconnected nodes in the maze we start merging the subgraphs by making the connections between them indicated by the orange arrows. What we are left with in the end is a complete square maze represented using a graph.
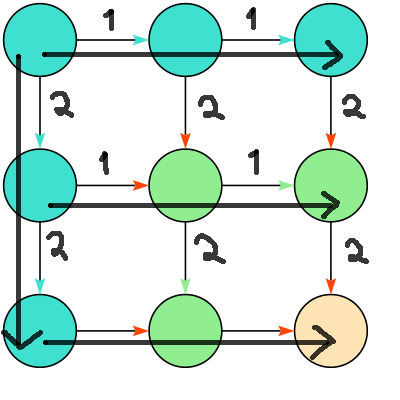
One final detail I needed to work out is that when working with a grid, it is sometimes necessary and convenient to access the cells as rows and columns. The property of graphs that is useful this time is the ability to attach weights (or labels) to the edges. By having all the edges connecting horizontally oriented nodes have a weight of one and all the ones connecting vertical nodes have a weight of two, traversing all nodes the same way as a nested for loop involves traversing horizontally following the 'one' edges for all the nodes across the first column of 'two' edges2.
Writing The Code
With everything somewhat worked out all that was left was to write some code. Thankfully there was no need to implement an entire graph library from scratch as I found a fairly good one in fgl. First step is to create an empty graph with empty here meaning that none of the nodes are connected to each other i.e there are no edges.
emptyEdges :: [LEdge Int]
emptyEdges = []

mazeGraph :: Int -> Gr Int Int
mazeGraph n = mkGraph (zip nodes nodes) emptyEdges
  where
    nodes = [1 .. n :: Node]
n is the number of nodes you want so for a 10x10 maze n would be 100.
The next thing we need is a way to create an edge between two nodes. Since
the type for a labelled edge is type LEdge b = (Node, Node, b) i.e a tuple
of two nodes and a label, this is easy enough. link connects a list of
nodes into a chain.
connect :: Int -> Node -> Node -> LEdge Int
connect n x y = (x, y, n)

link :: Int -> [Node] -> [LEdge Int]
link n (x:y:xs) = connect n x y : link n (y : xs)
link _ _ = []
To actually create a square maze we need two functions asSquare which
creates the subgraphs and merge which combines them. Here's asSquare:
asSquare :: DynGraph gr => gr a Int -> Int -> Int -> gr a Int
asSquare g 1 1 = merge g sg where
  sg = subgraph [n] g
  n = head $ filter (noEdges g) (nodes g) :: Node
asSquare g _ 0 = g
asSquare g 0 _ = g
asSquare g l w = merge g (asSquare newGraph (l - 1) (w - 1)) where
  entry       = head orphans
  avail       = tail orphans
  horiz       = take (l - 1) avail
  vert        = (take (w - 1) . drop (l - 1)) avail
  linkedHoriz = link 1 $ entry : horiz
  linkedVert  = link 2 $ entry : vert
  newGraph    = insEdges (linkedVert ++ linkedHoriz) g
  orphans     = filter (noEdges g) (nodes g)
From the type of the function we can see that it takes:
- A graph (
gr a Int) withIntedge labels used for themergestep. - Two
Intarguments which are the length and width of the required grid.
The first pattern covers when only a single node remains which in our image would be the bottom right node. In this case a singleton graph is created and merged with the one passed in. The two following cases handle rectangular mazes (when length and width are not the same) in which case the passed in graph argument is already the complete graph.
The last case contains the actual algorithm that picks a bunch of nodes
and joins them like we saw in the diagram. orphans is the pool of
nodes without any edges that we choose from at each step. We first
take one node to be the corner then l - 1 nodes for the horizontal
neighbours and w - 1 for the vertical ones and link them up. Then we
call merge on the result of recursing with the new graph and a reduced
length and width.
Here's what merge does:
merge :: DynGraph gr  => gr a Int -> gr a Int -> gr a Int
merge outer inner
  | all (noEdges outer) (nodes outer) = inner
  | otherwise =
    insEdges  (vert ++ horiz ++ innerCons) outer
  where
    innerHoriz = tail $ spf inner innerEntry
    innerVert  = tail $ lpf inner innerEntry
    innerEntry =
      case find (\x -> null (inn outer x) && null (out outer x)) (nodes outer) of
        Just x -> x
    outerHoriz = tail $ spf outer outerEntry
    outerVert  = tail $ lpf outer outerEntry
    outerEntry = x
      where
        x =
          last $
          filter
            (\x -> length (inn outer x) == 2 || length (out outer x) == 2)
            (nodes outer)
    vert      = zipWith (connect 2) outerHoriz (innerEntry : innerHoriz)
    horiz     = zipWith (connect 1) outerVert (innerEntry : innerVert)
    innerCons = labEdges inner \\ labEdges outer
For merge the only special case is when it's called with the graph with
no edges (i.e the start graph) and another one in which case the other one
is returned. In all other cases it's just a simple matter of finding the
horizontal, vertical and corner nodes of either graphs, and connecting them
up like we saw in the image with the orange arrows in the image. The
functions lpf and spf traverse neighbours by following either 'one'
(horizontal) edges or 'two' (vertical) edges respectively returning a list of
nodes. The merged graph is then created by inserting the new (and unique) edges
into the outer one.
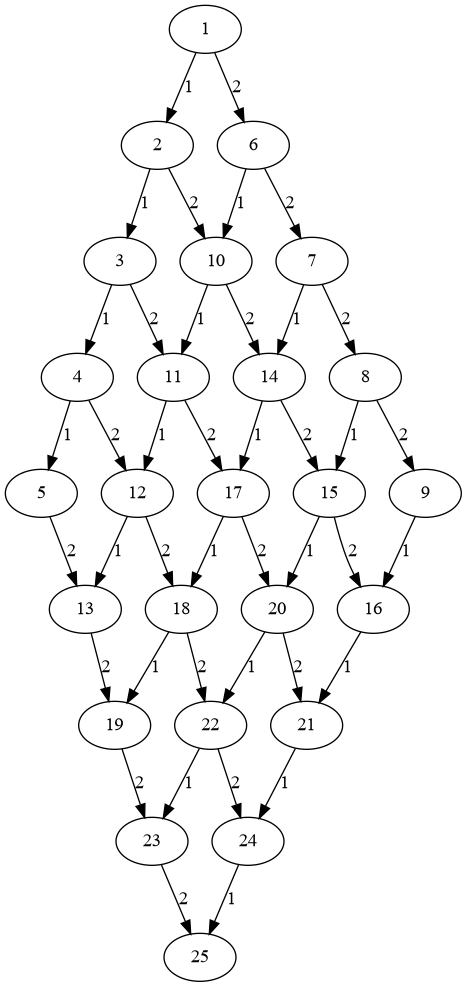
The result of running asSquare (mazeGraph 25) 5 5 is the graph3:
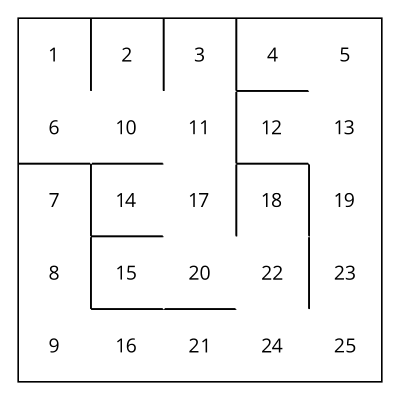
Running the binary tree maze generation algorithm on the resulting 'square' graph yields:
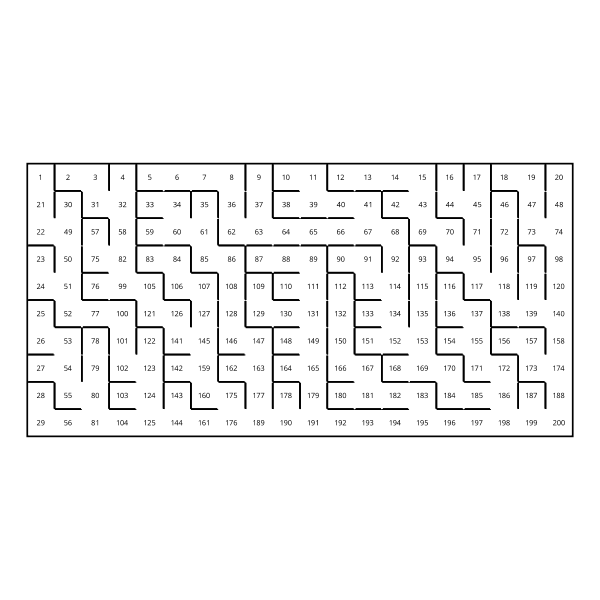
In case you're wondering, more general rectangular mazes work as well:
Final Thoughts
Haskell is known for being a bit complicated but what I have realized so far is that it only requires a slight adjustment in how you approach problems. Most of the work with programming in Haskell like with every other language still remains in first working out the details in your head. Afterwards writing code is almost straightforward.
When I started writing this article I thought that the code was really complicated but now it seems almost trivial (I hope). I've always wanted to work with graphs and this project is perfect for that so expect a few more articles in the coming weeks. Anyone reading this should consider picking up a copy of Mazes for Programmers it's a great book. Don't worry if you don't know Ruby which is what the author uses, the code samples are an added bonus but the book goes over all the details you need to know to follow along in whichever language you prefer.
Going Further
- The fgl library is a true gem.
- diagrams is another gem which I used to produce the Divide and Conquer illustration and draw the mazes.
- I recently learnt about another more recent graph library that although doesn't support what I need, is still pretty cool. The corresponding paper, Algebraic Graphs with Class is also very well written and surprisingly easy to follow.
- Wikipedia contains a glossary of graph theory terms that is a handy reference
- The repo with the code for this project is on GitHub.